Project Summary & Skills Used
This project is a tool designed to simulate the entire March Madness tournament while focusing the visual results on the Sweet 16. We used March Madness data from 2011 to 2018 to train a model that can guess the probability of one team beating another. The app doesn’t just pick a winner once; it runs the whole tournament thousands of times (Monte Carlo simulation) to find out which team has the best statistical chance to win it all.
Industrial Engineering Context: We applied predictive analytics and simulation to model a complex system with random outcomes. This is a common IE task used to make better decisions based on data and might help the user decide which teams to pick for their own bracket to have the best chance of winning.
- Organizing the Stats: We picked specific stats to show on the website for comparison, but the math for the matchup analysis and the bracket still used the full dataset to make the predictions accurate.
- Vaadin: We built a professional-looking website that people can actually interact with.
- SMILE & Tablesaw: We used these for the machine learning (Random Forest) and for cleaning up the big data files.
- Monte Carlo Simulation: We wrote logic to run the tournament thousands of times to handle the “madness” and upsets.
- Making it all work together: We made sure the data, the math, and the website all connected and ran together as one without any bugs.
Project Development Process
The Original Goal: At the very beginning, we just wanted to see if we could use machine learning to simulate March Madness and predict a single winner. The plan was pretty basic. We just had to train a model and have it output the team with the best chance of winning the tournament.
How it Evolved: Once we got further into the project, we realized that just seeing the winner wasn’t as exciting. We decided it would be much better to actually see the path from the Sweet 16 to the championship winner, so we built the bracket. From there, the project kept growing. We added the “Team Stats” tab so users could see the March Madness data from 2011-2018 for themselves. We also made a “Matchup Analysis” section where you could compare any two teams side-by-side with charts before running the simulation.
Roadblocks: We hit a few walls with the bracket logic. At first, teams were showing up in random spots that didn’t match the real tournament regions. We fixed this by hardcoding the teams in the exact order they appear in the real bracket. This made sure the matchups followed the correct regions and the winners moved forward the right way.
Final Outcome: The final project changed quite a bit from what we first planned. At the start, the goal was just to make a basic tool that could predict a winner and it ended up becoming much more than that. We built a real bracket, comparison charts and many other features that we have already mentioned. It definitely exceeded our expectations by being way more interactive and professional that our original idea.
Key Features or Highlights
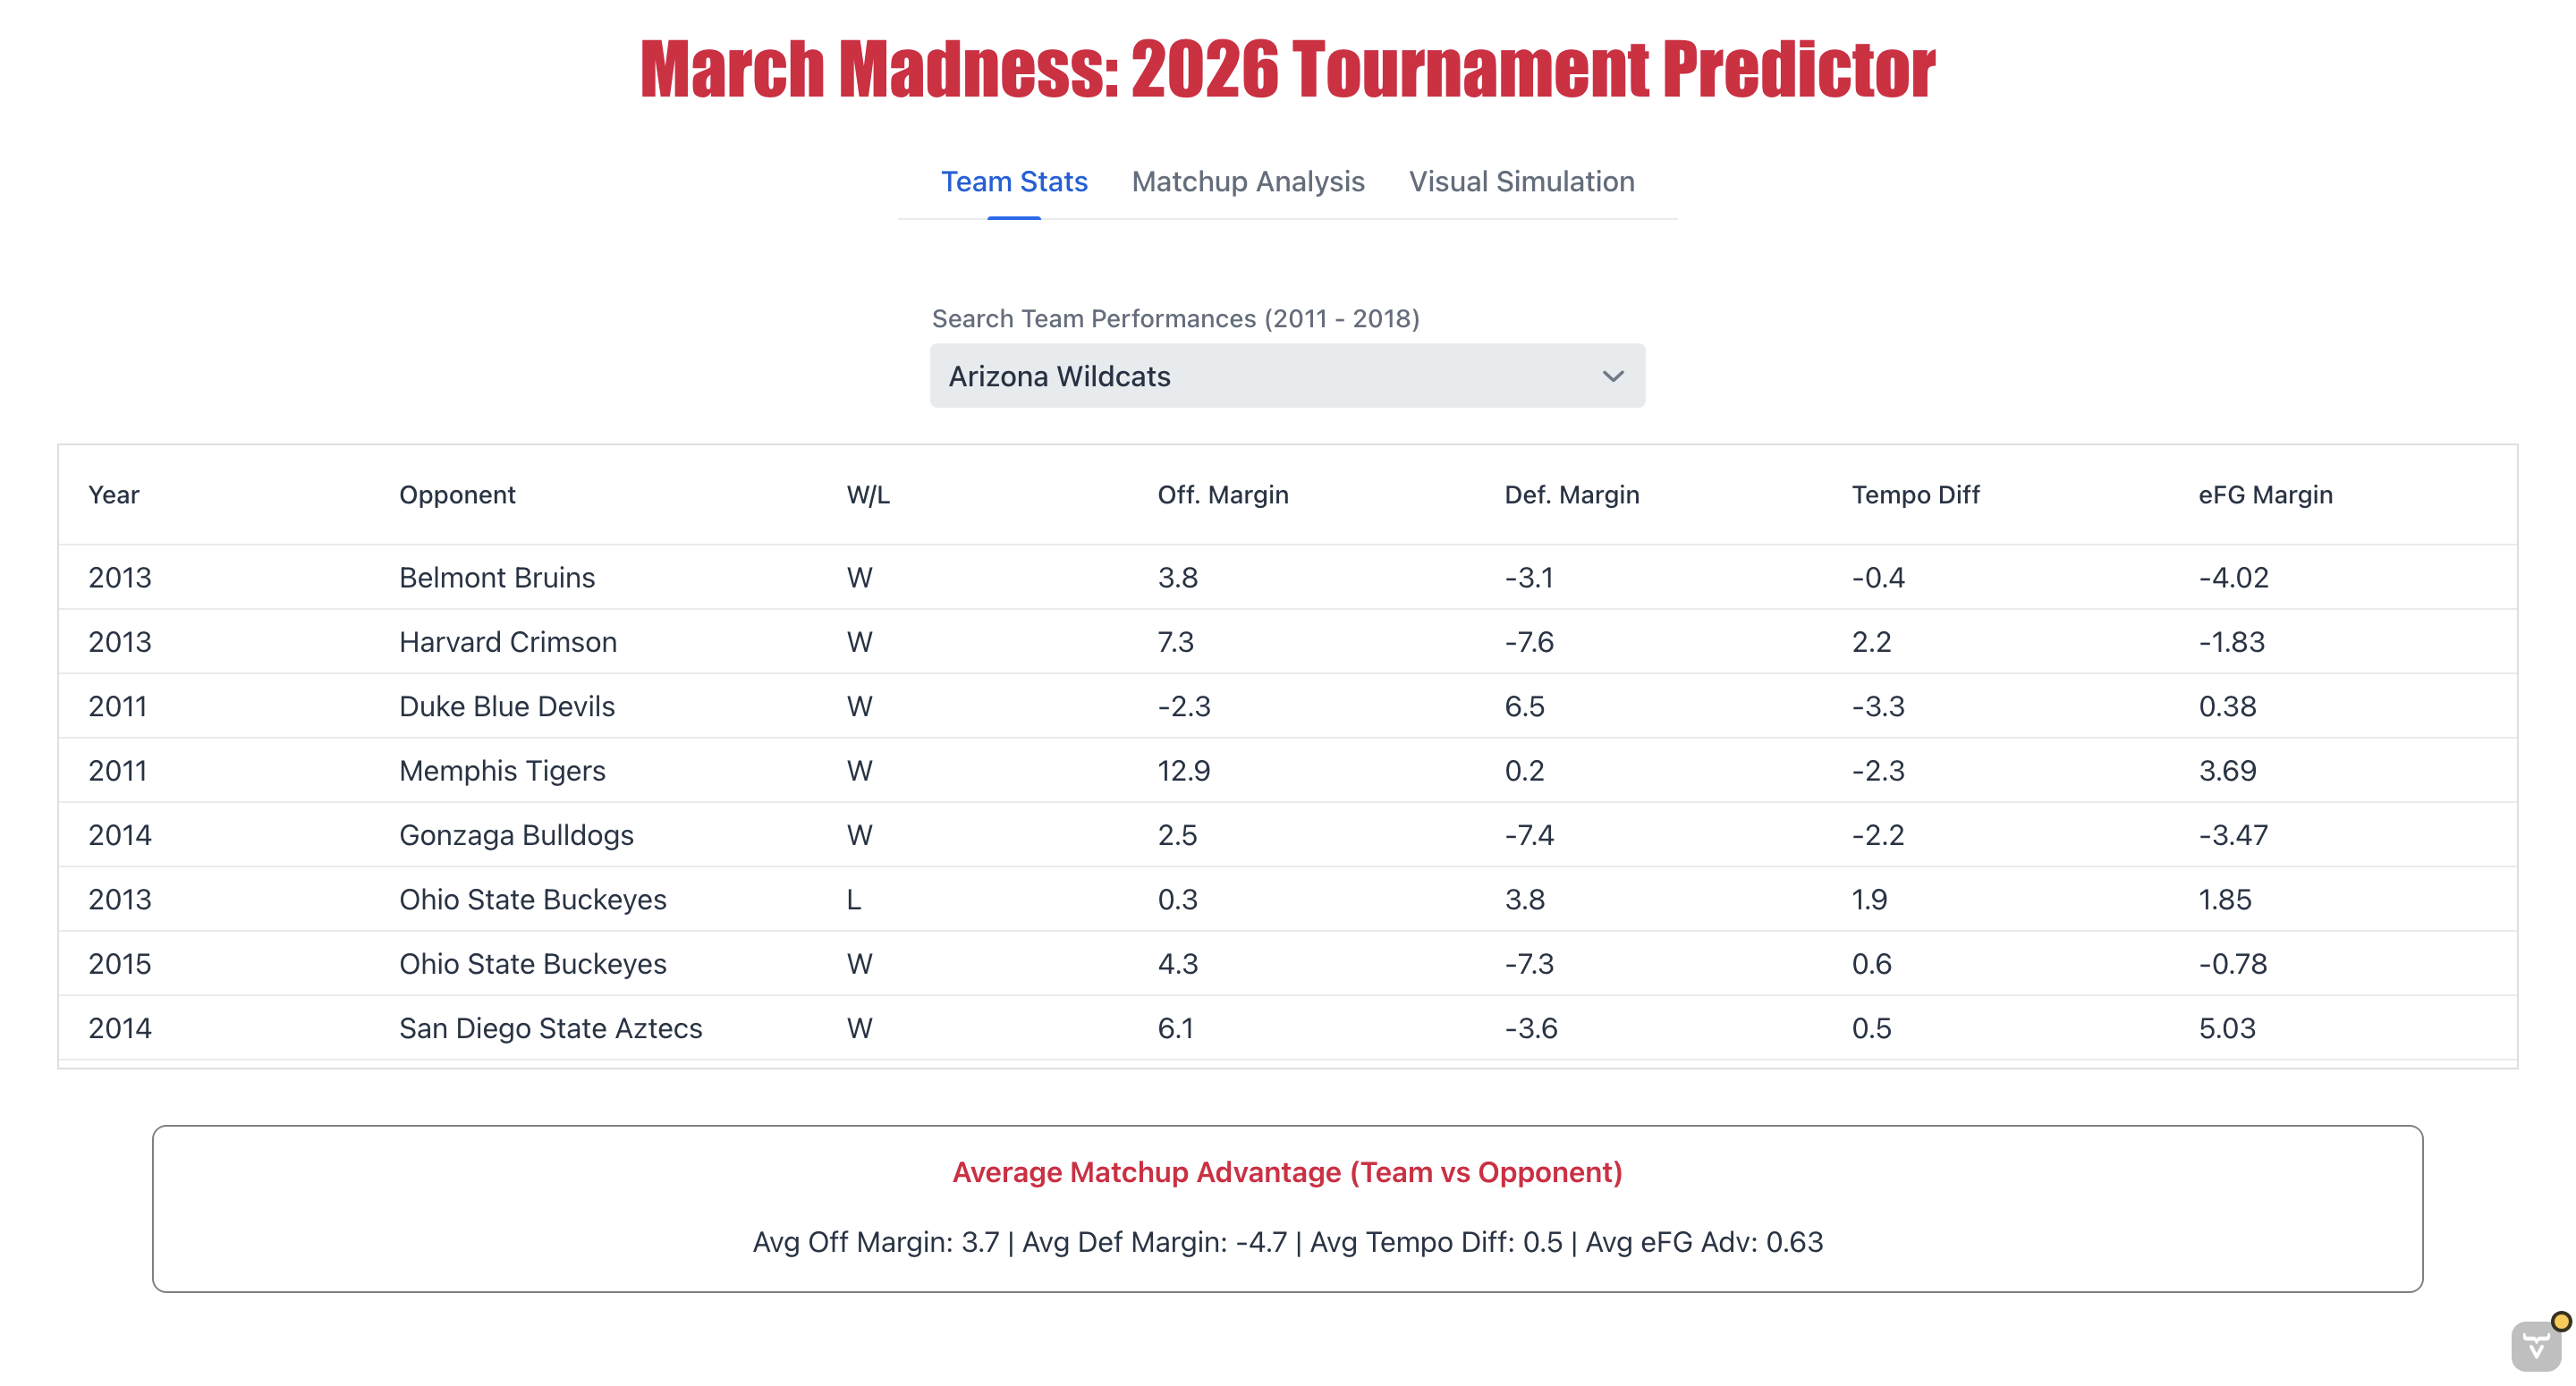
Team Performance Data
This section shows team stats from 2011 to 2018. We used Tablesaw to clean and filter the data so users can search for a team and see their wins and losses along with other important stats in the grid. Once a team is picked, the app also calculates and shows their average stats from those years at the bottom of the screen to give a better idea of how they performed.
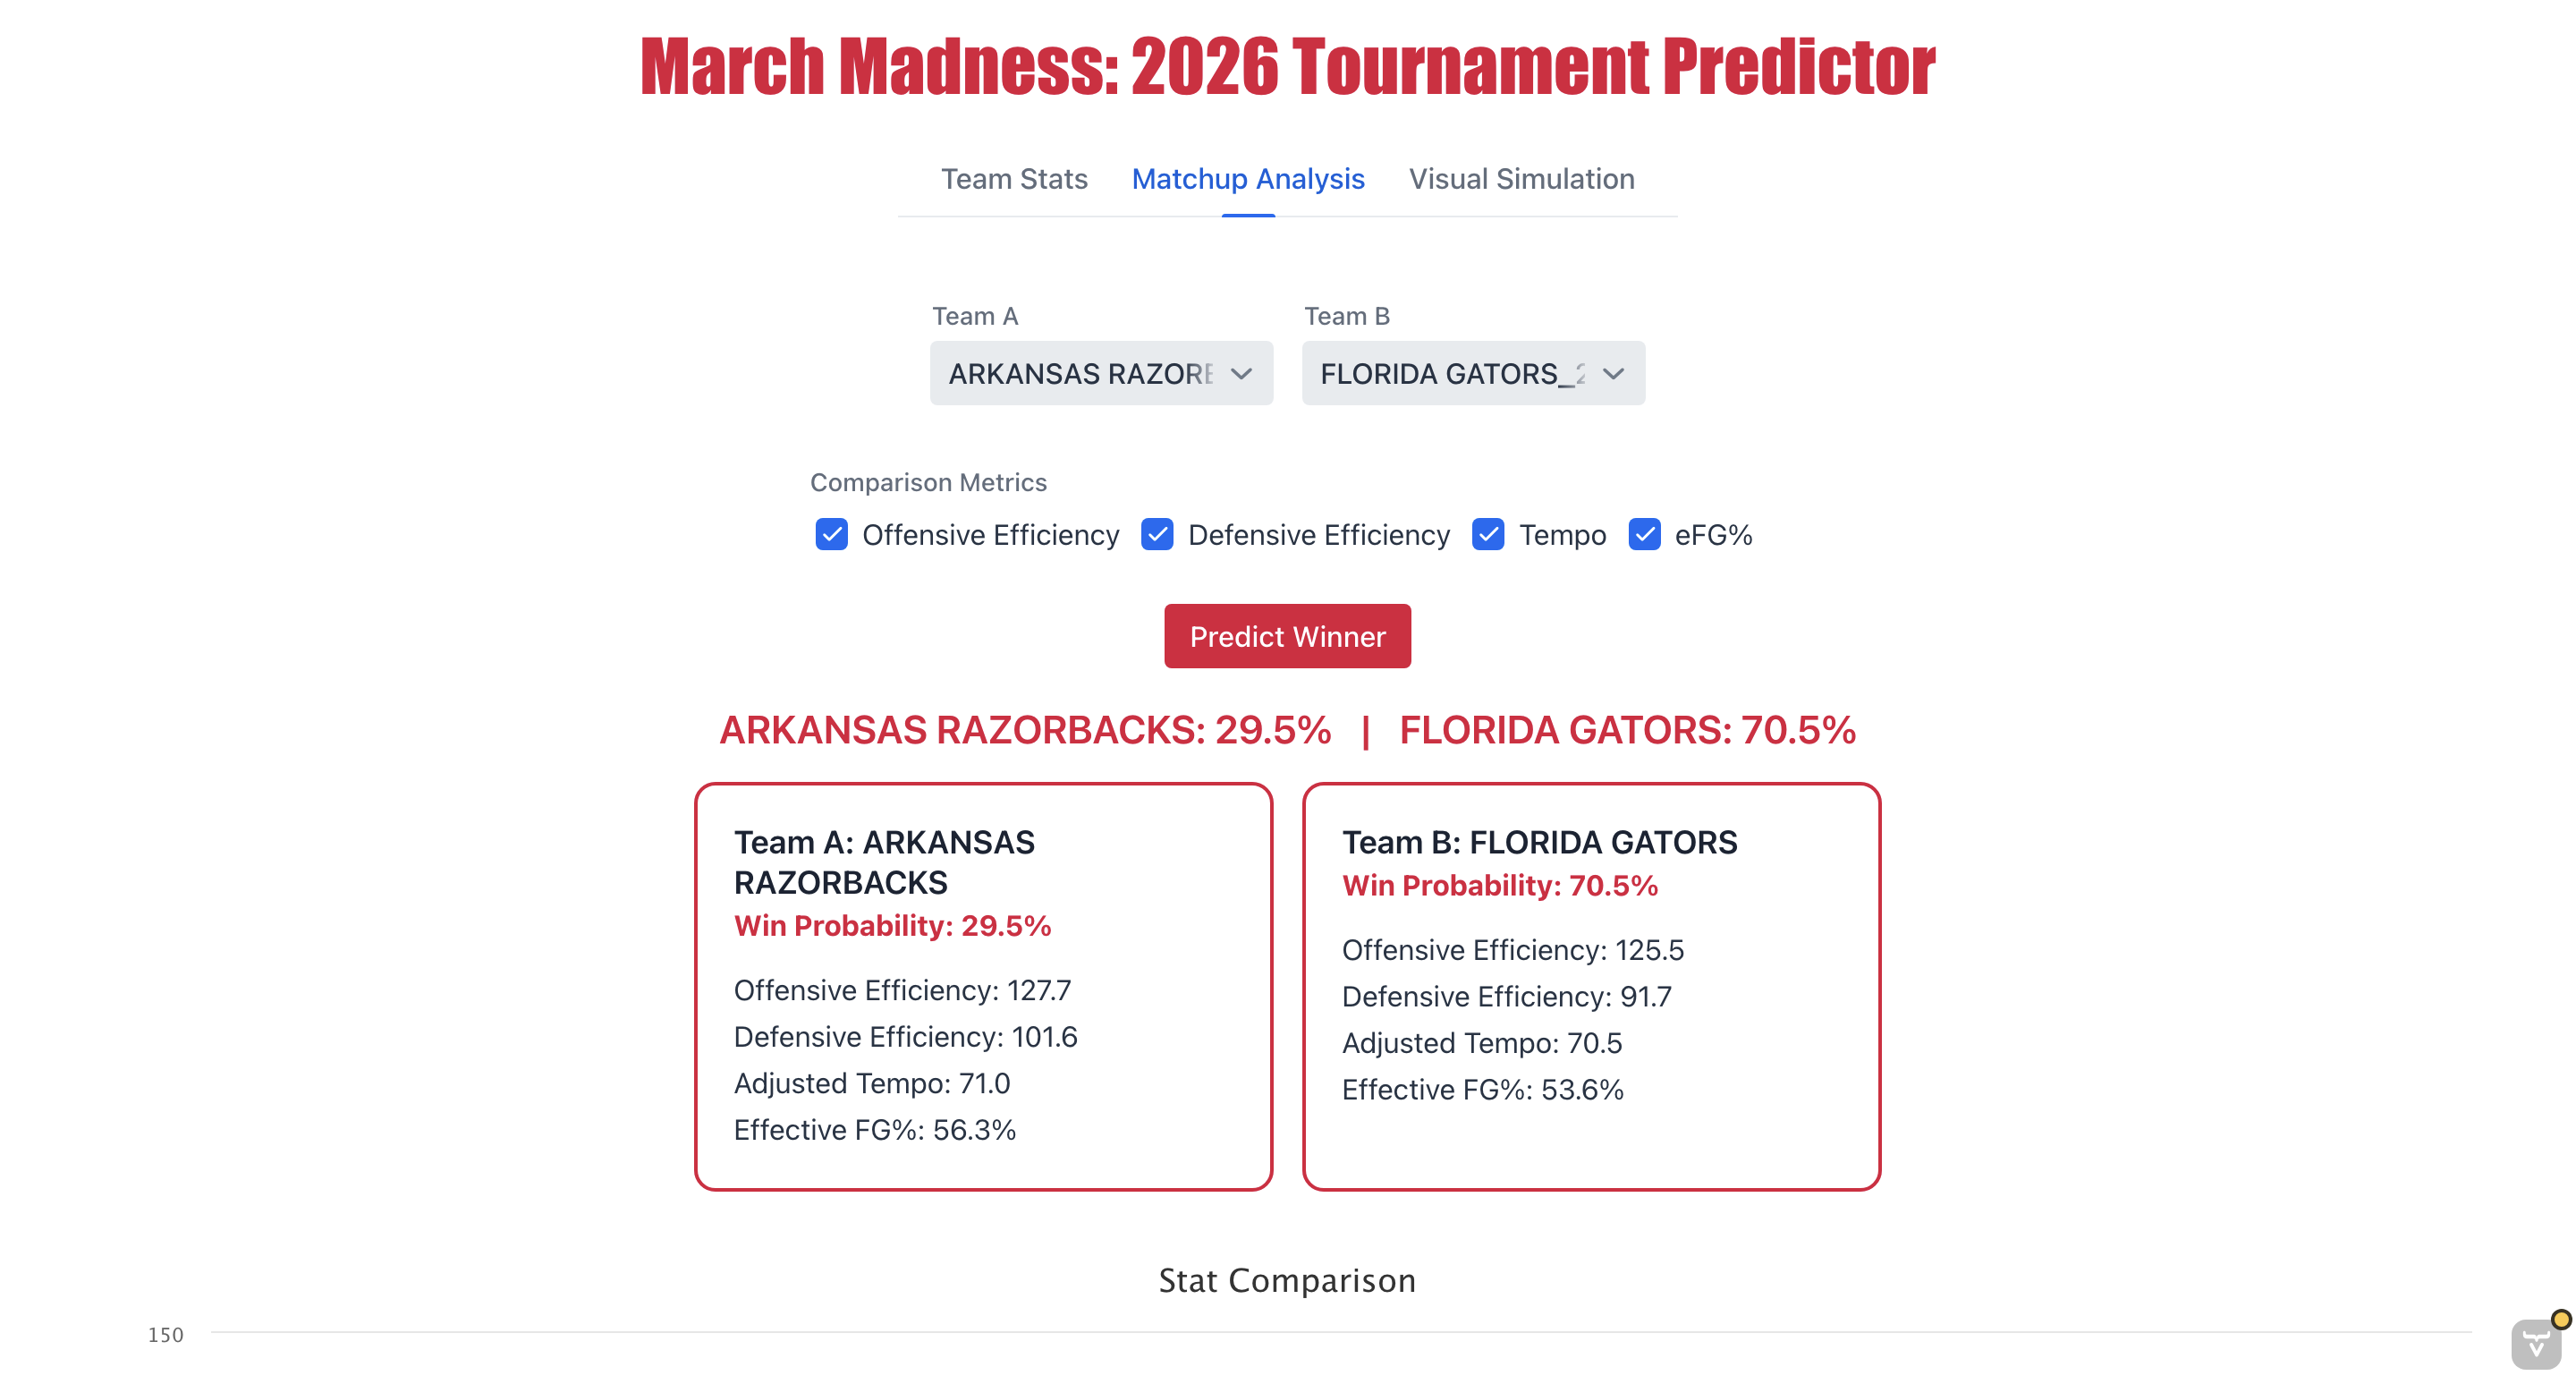
Matchup Analysis
This part lets users select any two teams to see their win probability against each other. We used a Random Forest model through the SMILE library to make these predictions as accurate as possible.
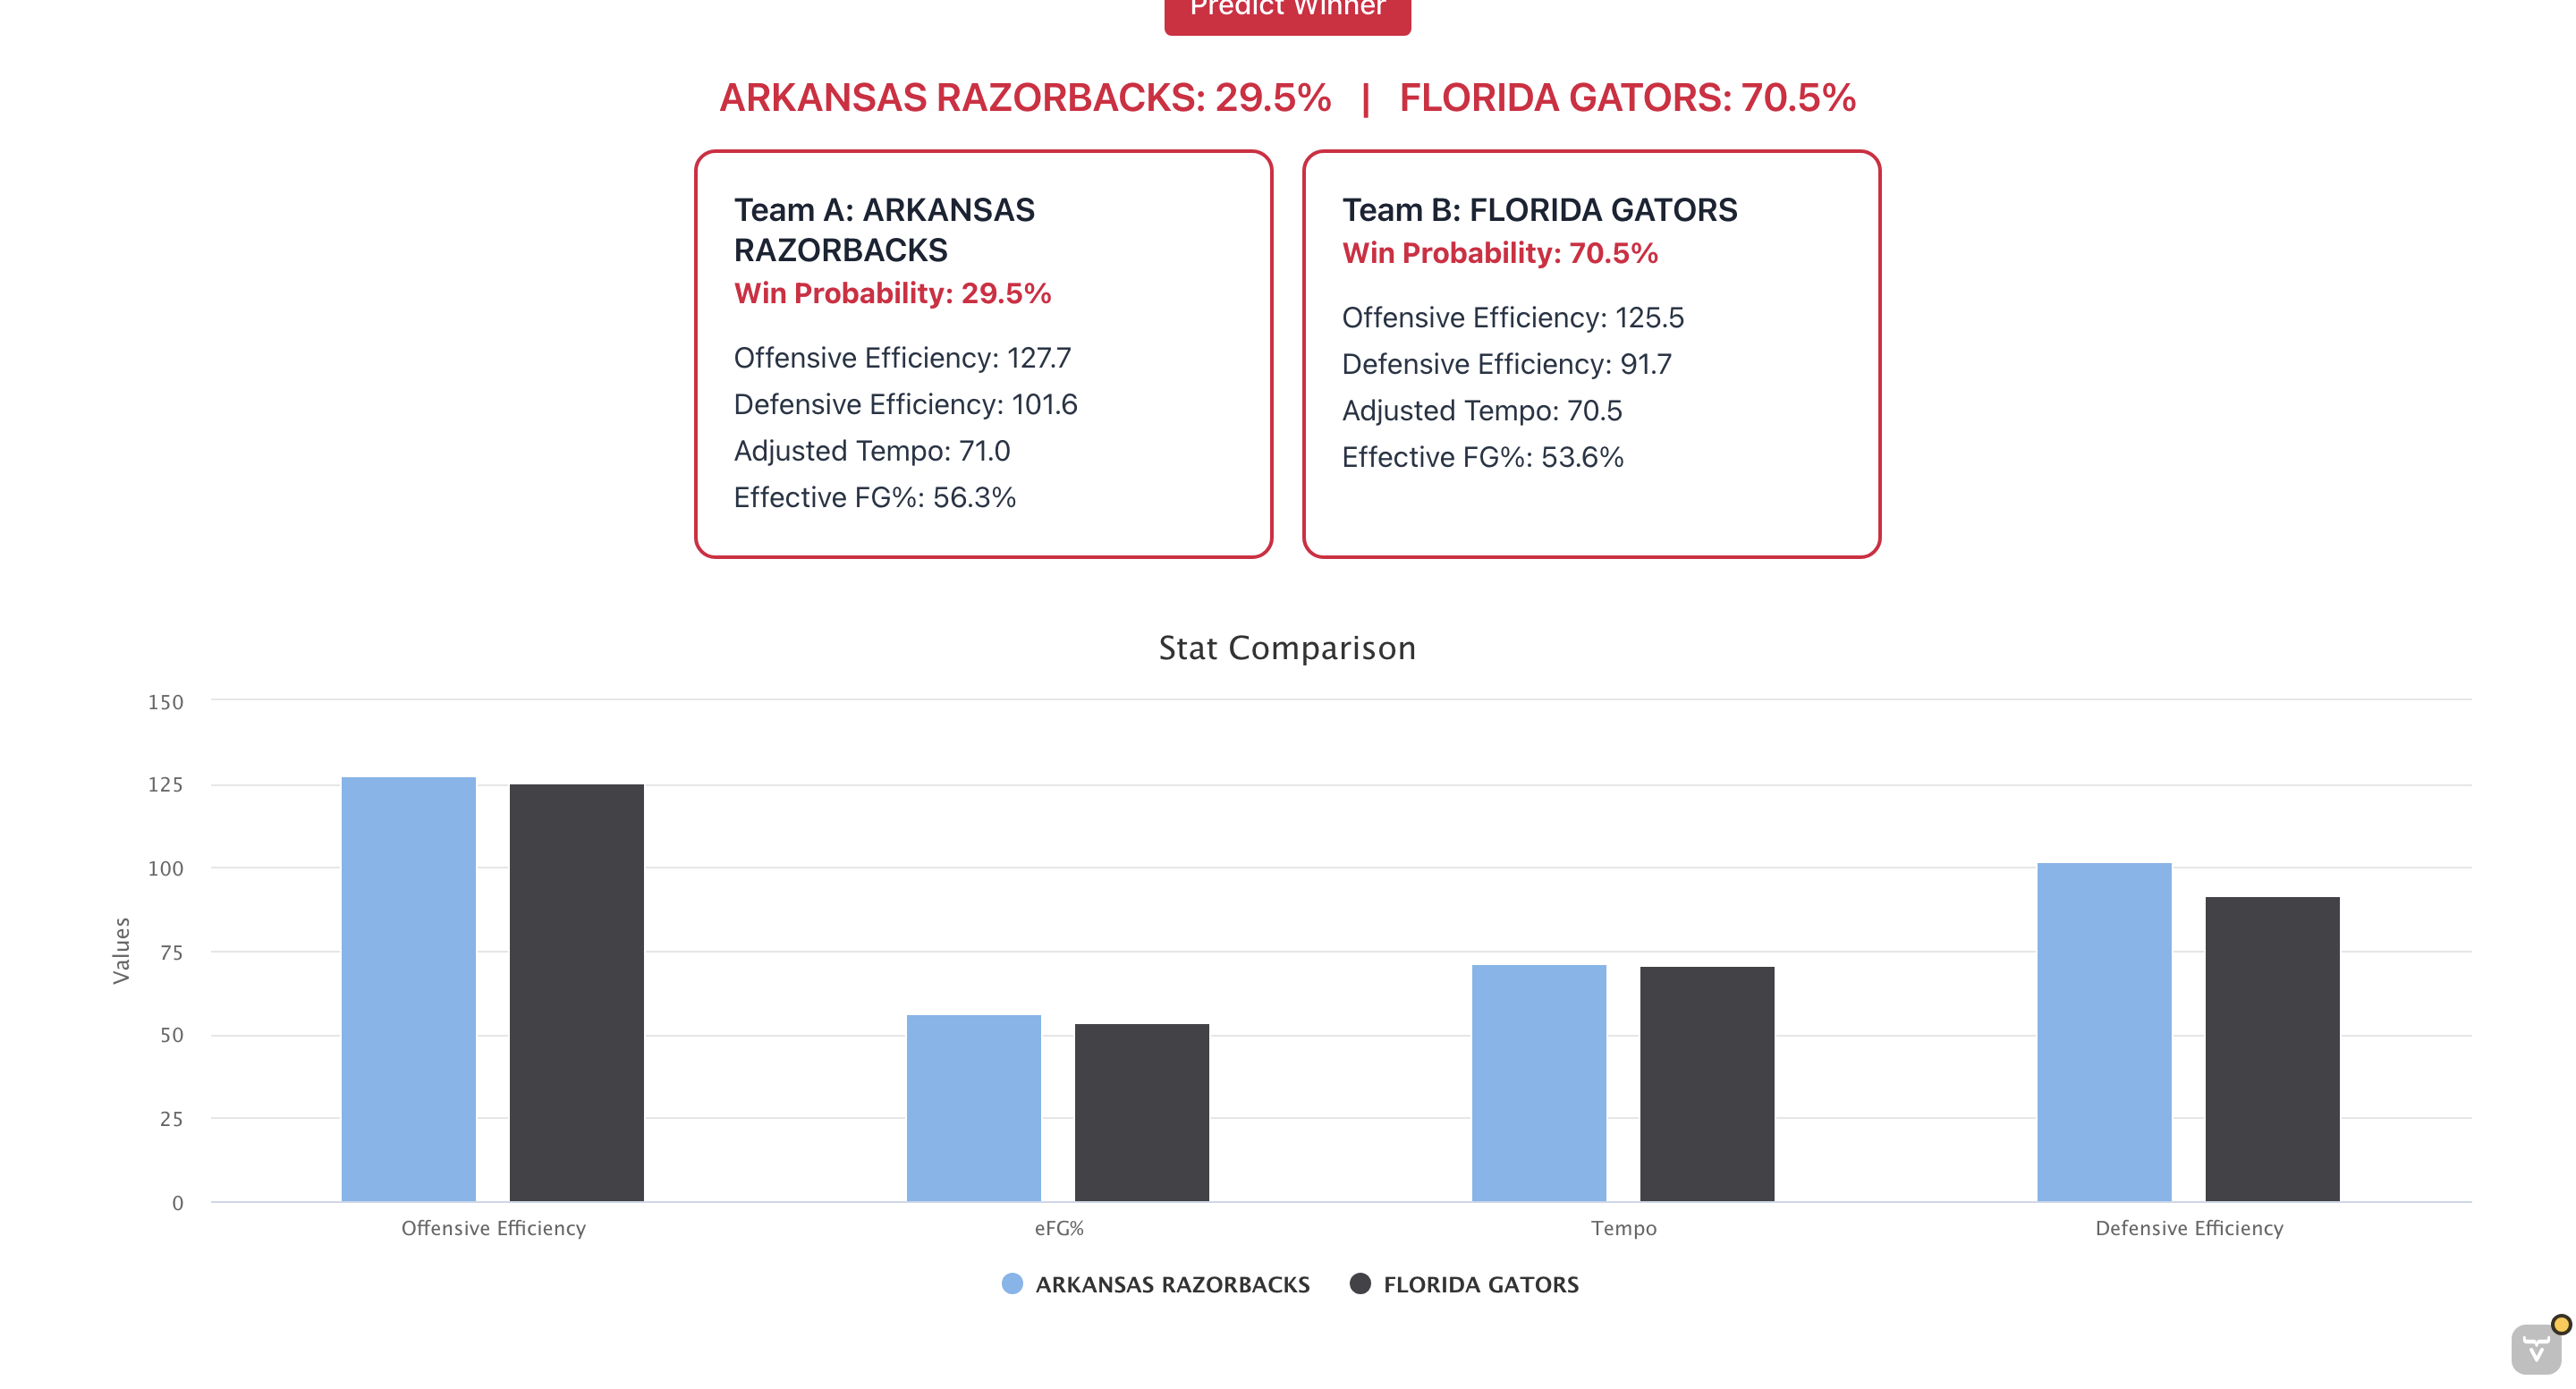
Interactive Comparison Charts
We added side-by-side bar charts so you can see how two teams’ stats (like Offensive and Defensive Efficiency) look next to each other for a better comparison.
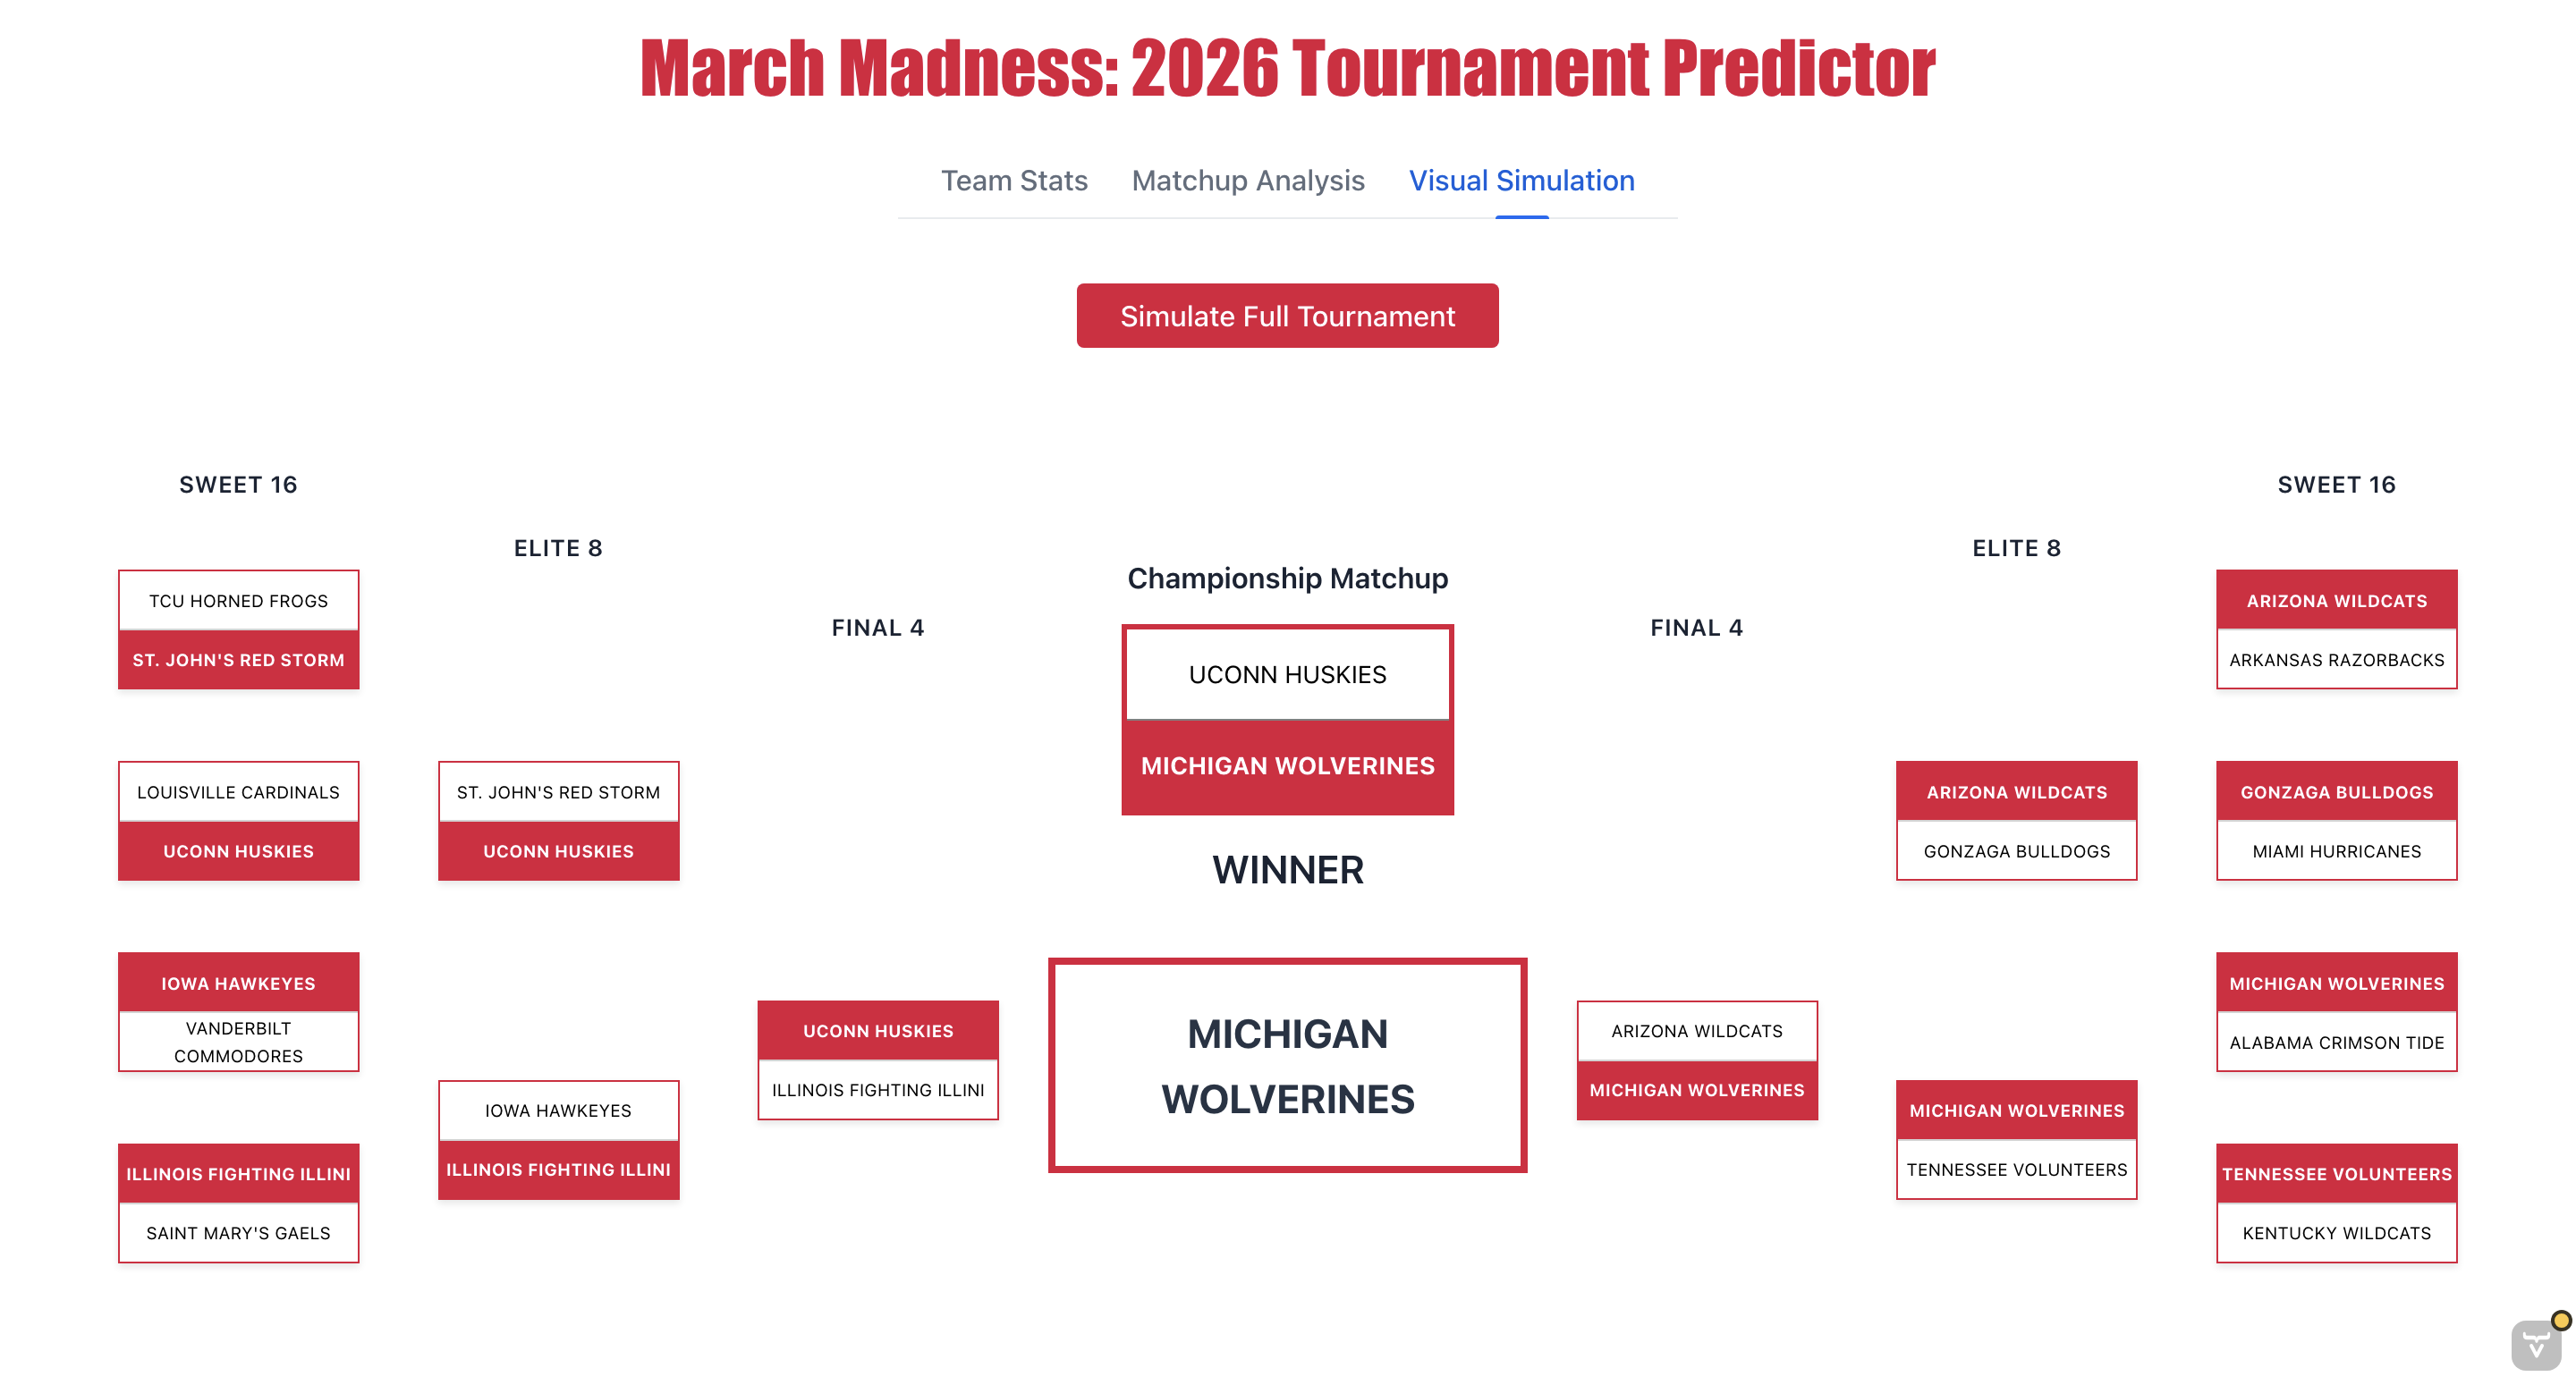
Visual Tournament Bracket
The simulation tab has a visual bracket that moves from the Sweet 16 on the outside into a big winner box in the middle. It looks just like a real March Madness bracket and make it easy to see the results of each round.
Reflection
Working on this project really showed me how much goes into making all the different parts of a site work together. I learned a lot about fixing bugs with my team and getting everything to line up correctly on the screen. I contributed to a lot of the tabs in the app, but the visual bracket is definitely the part I’m most proud of.
I grew as a coder and problem-solver because this project took a lot of the different skills we practiced all semester and combined them into one big application. I also grew as a teammate by learning how to communicate better with my group. I made sure to give them regular updates on the UI and was always open to their feedback when we had to work together to fix things, like the bracket ordering, to make the project better.
I feel way more confident now than I did at the start of the year, especially with using Vaadin and Tablesaw. Our previous assignments really prepared me for this project by teaching me how to handle data and build different tabs. Practicing those skills earlier made it much easier to put this whole application together, and I feel a lot better about my coding skills now.